Direction (1-5): Study the following information carefully and answer the questions given below.
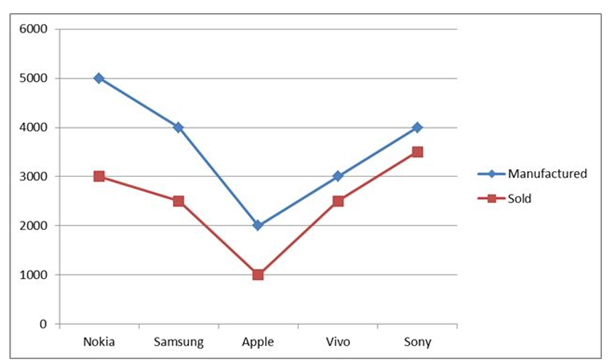
The given line graph shows the number of mobiles manufactured and sold in five different companies in 2018.
1) The number of Nokia and Sony mobile sold together is approximately what percent of the total number of mobiles manufactured in Nokia and Apple together?
A) 87%
B) 90%
C) 93%
D) 96%
E) 101%
2) What is the difference between the average number of mobile manufactured in Samsung, Apple and Vivo together and the average number of mobile sold in Vivo, Samsung and apple together?
A) 800
B) 1000
C) 1500
D) 2000
E) None of these
3) What is the average number of mobile unsold in all the companies together?
A) 1000
B) 1100
C) 1200
D) 1300
E) None of these
4) The number of unsold Sony mobile is approximately what percent of the total number of manufactured in Samsung mobile?
A) 12.5%
B) 18.5%
C) 22.5%
D) 25%
E) None of these
5) What is the ratio of the number of mobile sold in Apple and Nokia together to the number of mobile sold in Sony?
A) 6:5
B) 7:6
C) 8:7
D) 9:8
E) None of these
Data Interpretation
Direction (6-10): Study the following information carefully and answer the questions given below.
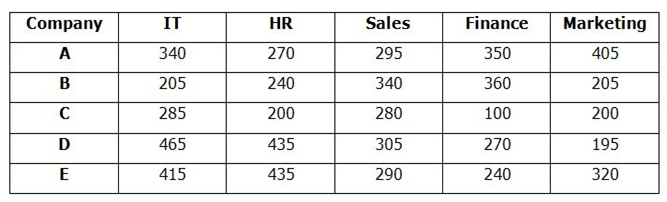
The given table shows the number of employees in five different companies in five different departments – IT, HR, Sales, Finance and Marketing.
6) What is the difference between the average number of IT department employees from E and C together and the average number of Finance department employees from A and B together?
A) 10
B) 8
C) 7
D) 5
E) None of these
7) What is the ratio of the total number employees from D in all the departments together to the total number of employees from B in all the departments together?
A) 167:135
B) 165:133
C) 168:139
D) 14:11
E) None of these
8) What is the average number of Marketing department employees in all the companies together?
A) 245
B) 255
C) 265
D) 275
E) None of these
9) The number of HR department employees from E is approximately what percent of the total number of employees from A in all the departments together?
A) 26%
B) 28%
C) 30%
D) 32%
E) None of these
10) What is the difference between the total number of HR and Sales department employees from all the companies together?
A) 50
B) 60
C) 70
D) 80
E) None of these
Answers :
Directions (1-5) :
1) Answer: C
Required percentage = (3000 + 3500)/(5000 + 2000) * 100
= 93%
2) Answer: B
Difference = (4000 + 2000 + 3000)/3 – (2500 + 2500 + 1000)/3
=3000 – 2000
=1000
3) Answer: B
Unsold Nokia mobile = 5000 – 3000 = 2000
Unsold Samsung mobile = 4000 – 2500 = 1500
Unsold Apple mobile = 2000 – 1000 = 1000
Unsold Vivo mobile = 3000 – 2500 = 500
Unsold Sony mobile = 4000 – 3500 = 500
Average = (2000 + 1500 + 1000 + 500 + 500)/5
= 1100
4) Answer: A
Unsold Sony mobile = 4000 – 3500 = 500
Required percentage = (500/4000) * 100 = 12.5%
5) Answer: C
Required ratio = (1000 + 3000):3500
= 8:7
Directions (6-10) :
6) Answer: D
Average of IT department employees from C and E = (285 + 415)/2 = 350
Average of Finance department employee from A and B = (350 + 360)/ 2= 355
Difference = 355 – 350 = 5
7) Answer: A
Required ratio = (465 + 435 + 305 + 270 + 195): (205 + 240 + 340 + 360 + 205)
= 1670: 1350
= 167: 135
8) Answer: C
Average = (405 + 205 + 200 + 195 + 320)/5
= 265
9) Answer: A
Required ratio = 435/(340 + 270 + 295 + 350 + 405) * 100
= 26%
10) Answer: C
HR = 270 + 240 + 200 + 435 + 435 = 1580
Sales = 295 + 340 + 280 + 305 + 290 = 1510
Difference = 1580 – 1510 = 70