Directions (01-05): Study the following information carefully and answer the questions given below.
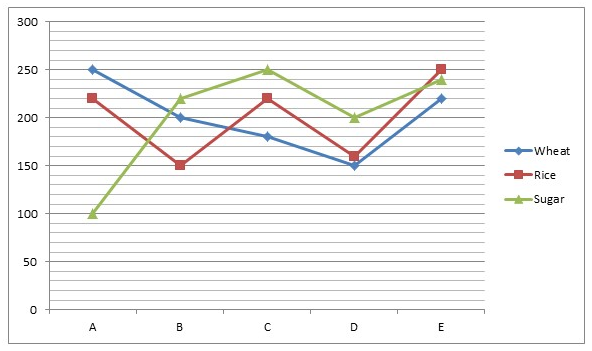
The given line graph shows the consumption of Wheat, Rice and Sugar (in kg) in five different family in March.
1) What is the average consumption of Sugar in all the families together?
A.200 kg
B.204 kg
C.208 kg
D.210 kg
E.None of these
2) What is the ratio of the Wheat, Rice and Sugar consumed in B to D?
A.19:17
B.15:11
C.21:19
D.20:17
E.18:11
3) The amount of Rice consumed in B is approximately what percent of the amount of Wheat, Rice and Sugar consumed in E?
A.18%
B.21%
C.24%
D.27%
E.15%
4) What is the difference between the Wheat consumed in B and C together and the Sugar consumed in D and E together?
A.40
B.50
C.60
D.70
E.80
5) The total amount of Rice, Wheat and sugar consumed in A is what percent of the amount of Rice, Wheat and Sugar consumed in C?
A.87.69%
B.89.31%
C.91.45%
D.84.56%
E.78.72%
Directions (06-10): Study the following information carefully and answer the questions given below.
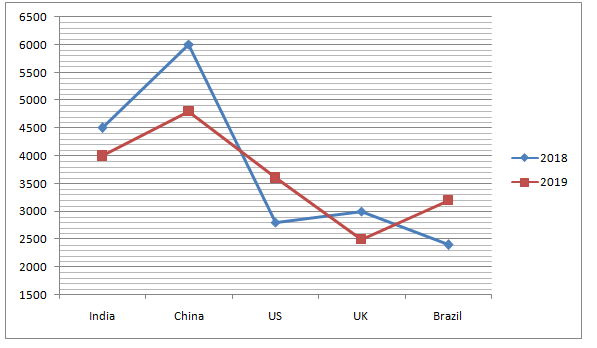
The given line graph shows the number of vehicles exported from five different countries in two different years.
6) The number of vehicle exported from Brazil in 2018 is what percent of the number of vehicle exported from China in 2018?
A.40%
B.50%
C.60%
D.70%
E.30%
7) What is the difference between the number of vehicle exported from India in 2018 and 2019 together and the number of vehicle exported from UK in 2018?
A.4500
B.5000
C.5500
D.6000
E.4000
8) What is the average number of vehicles exported from all the countries together in 2019?
A.3450
B.3480
C.3680
D.3620
E.3380
9) What is the difference between the average number of vehicles exported from US in 2018 and 2019 and the average number of vehicles exported from India in 2018 and 2019 together?
A.1010
B.1020
C.1030
D.1040
E.1050
10) The number of vehicles exported from China in 2019 is approximately what percent of the number of vehicles exported from Brazil and UK together in 2019?
A.84%
B.88%
C.80%
D.78%
E.92%
Answers :
1) Answer: E
Required average = (100 + 220 + 250 + 200 + 240)/5 kg
= 202 kg
2) Answer: A
Required ratio = (200 + 150 + 220):(150 + 160 + 200)
= 570:510
= 19:17
3) Answer: B
Required percentage = 150/(220 + 250 + 240) * 100
= 21%
4) Answer: C
Difference = (200 + 240) – (200 + 180) = 60
5) Answer: A
Required percentage = (250 + 220 + 100)/(180 + 220 + 250) * 100
= 87.69%
6) Answer: A
Required percentage = 2400/6000 * 100
= 40%
7) Answer: C
Difference = (4500 + 4000) – 3000
= 5500
8) Answer: D
Required average = (4000 + 4800 + 3600 + 2500 + 3200)/5
= 3620
9) Answer: E
Difference = (4500 + 4000)/2 – (2800 + 3600)/2
= 1050
10) Answer: A
Required percentage = 4800/(3200 + 2500) * 100
= 84%
Directions (11-15): Study the following information carefully and answer the questions given below.
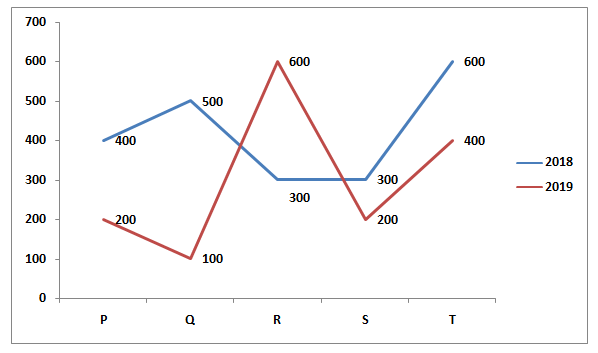
The below graph shows the number of employees working in five different companies in India in two different years
11) The number of employees working in company R in the year 2018 is what percent of the number of employees working in company P in the same year?
A.55%
B.65%
C.75%
D.85%
E.None of these
12) What is the respective ratio of the number of employees working in the company Q and S together in the year 2018 to the number of employees working in the company R and T together in the year 2019?
A.2: 3
B.3: 4
C.4: 5
D.5: 6
E.None of these
13) The number of employees working in the company R in the year 2019 is what percent of the number of employees working in company S in 2019?
A.100%
B.300%
C.150%
D.250%
E.None of these
14) Find the average number of employees working in all the companies together in the year 2018.
A.420
B.380
C.290
D.210
E.None of these
15) Find the ratio of the number of employees working in T in the year 2018 to the number of employees working in Q in 2019?
A.2: 3
B.3: 1
C.2: 9
D.6: 1
E.None of these
Directions (16-20): Study the following information carefully and answer the questions given below.
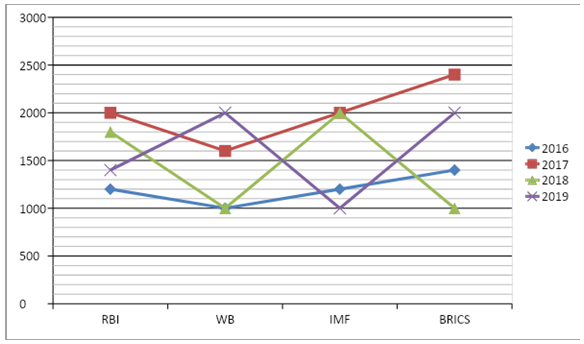
The given line graph shows the number of meetings held by four different organization in four years
16) What is the difference between the number of meeting held in all the organization together in 2018 and 2019?
A.400
B.600
C.300
D.800
E.500
17) The number of RBI meeting held in 2018 is approximately what percent of the total number of RBI meeting held in all the years together?
A.22%
B.28%
C.30%
D.32%
E.26%
18) What is the difference between the total number of WB meeting held in all years together and the number of BRICS meeting held in all the years together?
A.1200
B.1400
C.800
D.1000
E.1500
19) What is the ratio of the number of BRICS meeting held in 2019 and 2017 together to the number of IMF meeting held in 2016 and 2018 together?
A.7:4
B.8:5
C.9:5
D.10:9
E.11:8
20) The number of meetings held in 2016 in all the organization together is what percent of the number of meetings held in 2017 in all the organization together?
A.40%
B.50%
C.60%
D.70%
E.30%
Answers :
11) Answer: C
Number of employees working in company R in the year 2018 = 300
Number of employees working in company P in the same year = 400
Required % = 300/400 * 100 = 75%
12) Answer: C
Number of employees working in Q and S together in 2018 = 500 + 300 = 800
Number of employees working in R and T together in the year 2019 = 600 + 400
= 1000
Required ratio = 800: 1000 = 4: 5
13) Answer: B
Number of employees working in the company R in the year 2019 = 600
Number of employees working in company S in 2019 = 200
Required % = 600/200 * 100 = 300%
14) Answer: A
Required average = (400 + 500 + 300 + 300 + 600)/5
= 2100/5
= 420
15) Answer: D
Number of employees working in T in the year 2018 = 600
Number of employees working in Q in 2019 = 100
Required Ratio = 600: 100 = 6: 1
16) Answer: B
Required difference = (1400 + 2000 + 1000 + 2000) – (1800 + 1000 + 2000 + 1000)
= 6400 – 5800
= 600
17) Answer: B
Required percentage = 1800/(1200 + 2000 + 1800 + 1400) * 100
= (1800/6400) * 100
= 28%
18) Answer: A
Required difference = (1400 + 2400 + 1000 + 2000) – (1000 + 1600 + 1000 + 2000)
= 6800 – 5600
= 1200
19) Answer: E
Required ratio = (2000 + 2400):(1200 + 2000)
= 4400:3200
= 11:8
20) Answer: C
Required percentage = (1200 + 1000 + 1200 + 1400)/(2000 + 1600 + 2000 + 2400) * 100
= (4800/8000) * 100
= 60%