What is Correlation?
In statistics correlation, also known as dependence, is the statistical measure of a relationship between bivariate data, or any data involving two variables. Specifically, correlation refers to a linear relationship between two independent variables. The correlation coefficient is the numerical measure of a statistical correlation and indicates the strength of the relationship.
Positive vs. Negative Correlation: What’s the Difference?
Formulas for the correlation coefficient yield an absolute value between negative one and one.
- Positive correlation: A value of one indicates a strong positive relationship, otherwise known as a strong positive correlation or perfect positive correlation, between two points in the dataset. The closer a value is to one, the stronger the positive correlation.
- Negative correlation: A negative value of one indicates a strong negative relationship or a perfect negative correlation. The closer a value is to negative one, the stronger the negative correlation.
- No correlation: A value of zero means there is no relationship at all or a null hypothesis.
Some statisticians represent this data as linear correlation on a graph measuring X and Y values. If the relationship points increase and form a positive correlation, they will appear to have a positive slope on a scatter plot, meaning if you were to put a straight line through the data points, it would move upward from left to right. Conversely, if the data points appear to have a negative slope that moves downward from left to right, that would indicate a negative relationship.
4 Correlation Coefficient Formulas
Explore the most common ways to use correlation coefficients to measure correlation.
1. Pearson product-moment correlation: The most common correlation coefficient is the Pearson product-moment correlation, which measures a linear relationship or linear association between two variables. The Pearson correlation coefficient can be calculated for any data set that has a finite covariance matrix. Divide the covariance of two variables by the product of their standard deviations. This equation is expressed like this: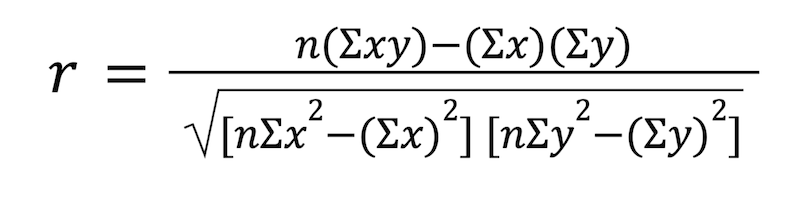
2. Sample correlation coefficient: In the sample correlation coefficient, Sx and Sy indicate the sample standard deviations and Sxy is the sample covariance. The equation is expressed like this: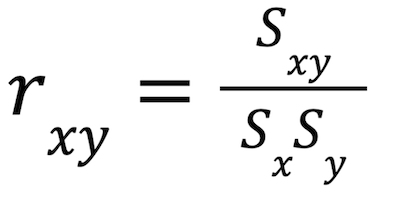
3. Population correlation coefficient: The population correlation coefficient is represented by the Greek letter ρ (rho) and the standard deviation is represented by the Greek letter σ (sigma). In this equation, σx is the standard deviation of X, σy is the standard deviation of Y, and σxy is the population covariance. The equation looks like this: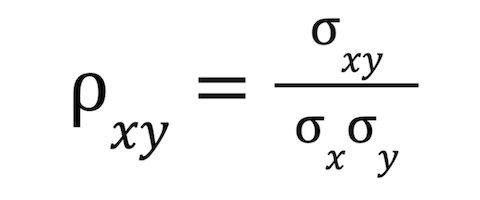
4. Rank correlation coefficients: Rank correlation coefficients, like Spearman’s rank correlation coefficient and Kendall’s rank correlation coefficient, measure how much one variable increases as another variable tends to increase and vice versa, only these do not require a linear relationship.
Correlation vs. Causation: What’s the Difference?
Correlation does not always indicate causality or a direct relationship between cause and effect. This is due to the possibility that correlation coefficients may appear to be related but are caused by factors unrelated to the study. Some studies may also lend much more relevance to the existence of outliers among the data points or unquantified relevance of factors like sample size.
3 Examples of Correlation in Everyday Life
Explore a few examples of correlation in everyday scenarios.
1. Positive correlations: Positive correlations may include the relationship between lemonade sales and the outside temperature, implying hot weather is related to an increase in cold beverage consumption. There may also be a positive relationship between height and bodyweight of similar body types, implying that taller people are more likely to weigh more than shorter people.
2. Negative correlations: Negative correlations might look like the relationship between time spent playing video games before taking a test and a student’s exam scores. In this hypothetical scenario, linear regression would indicate that the more the student played video games before a test, the lower their test scores. Another hypothetical regression line on a data set might measure the cost of a menu item to the number of sales that the menu item receives, implying a negative correlation between sales and higher costs.
3. Null hypotheses: Null hypotheses will likely be the result of relationships that have no indication correlation, such as the height of a person and their score on an exam, or the amount of lemonade a person drinks and their shoe size.